
Average 2PA distance, explained

Over the holiday break, we added a new stat to the team page: average 2PA distance. This metric is pretty much self-explanatory. It’s a team’s average distance on its (or its opponents’) 2-point attempts. In a kenpom.com exclusive, it also includes distance on two-point shooting fouls. It’s the simplest way to describe a team’s 2-point shot distribution.
Since the now-deceased hoop-math.com first broke down shot distribution in every conceivable way in the early 2010’s, it’s been customary to show a team’s shooting tendencies from various zones on the floor. This is neat if you want to drill down, but what about the big picture? What about the biggest/simplest picture possible? That’s two-point attempt distance.
Obviously, this measure is going to be influenced by quality of opponent but we present this data without adjustment for opponent. In addition, there’s really not much difference in expected value between a 10-foot shot and a 20-foot shot. We could treat those shots nearly the same instead of just using the raw value.
So we could do these things and produce something called Adjusted Expected Average 2PA Value (AEA2PAV). That would be more accurate, I guess. But we tend to lean on the side of not adjusting stats in the hopes of more general adoption by fans and media. Therefore, we simply present the raw average.1 This is another “advanced” stat that is useful and easy to understand.
There was some debate at kenpom HQ about whether this should be presented as a style stat or a skill stat. Obviously, teams that have a lower average shot distance tend to shoot better. I mean, you’d love to just dunk the ball all of the time. Here is the relationship between 2PA distance and 2P FG% for each team-season from 2022 to 2025:
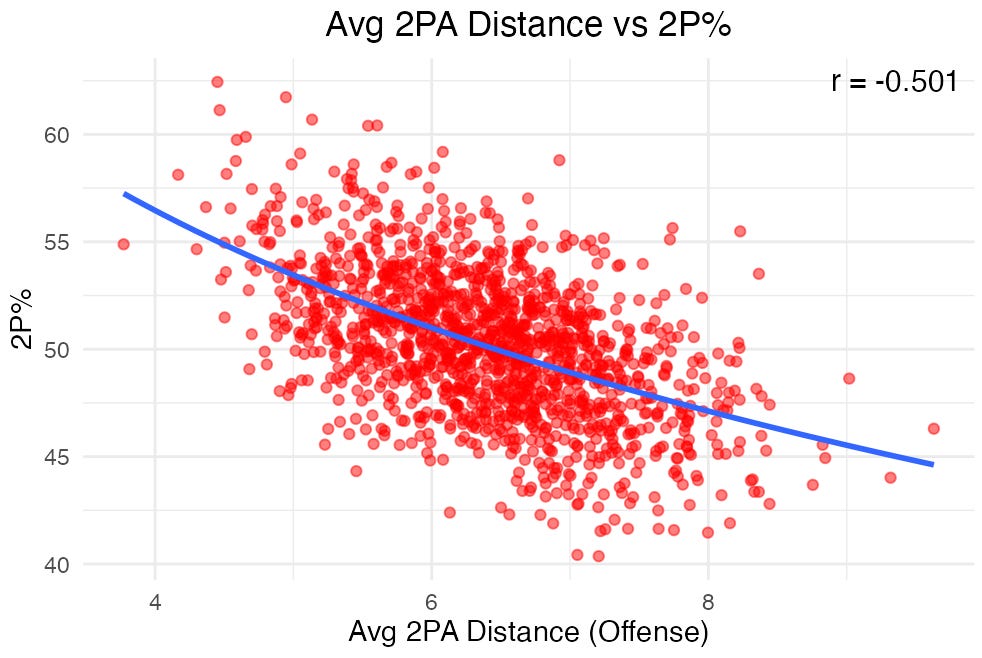
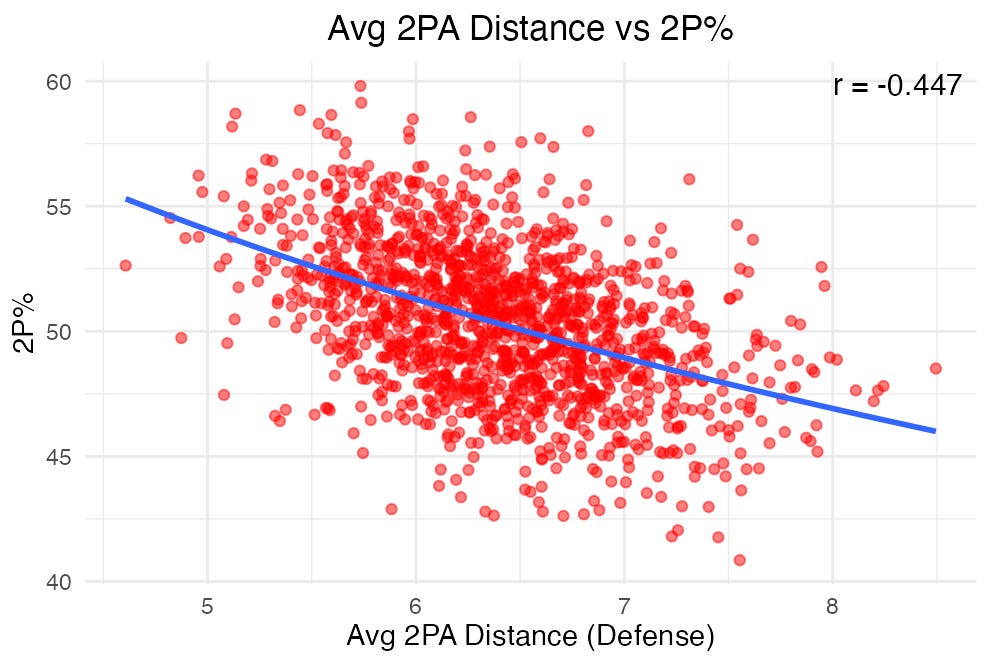
Naturally, the same is true on defense. Though the relationship is a bit weaker, giving us evidence that this is a measure controlled more by the offense than the defense:
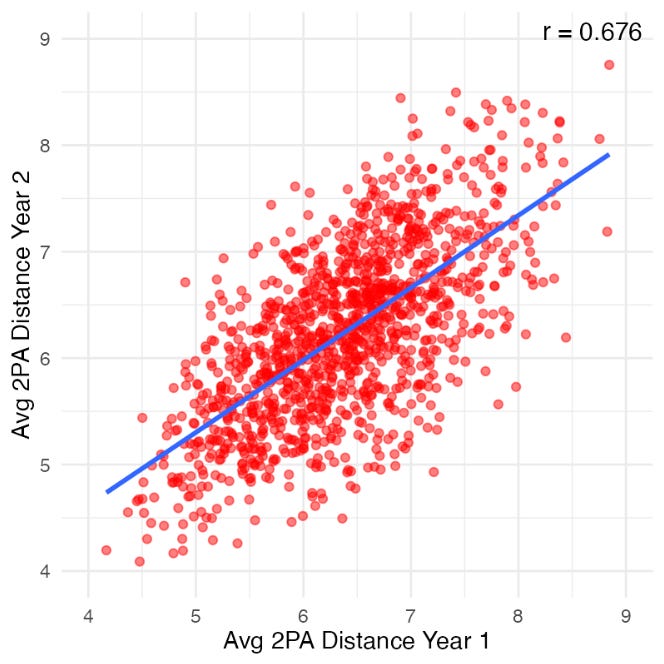
So it must be a skill stat, right? Whoa, not so fast. Average 2PA distance is also very much a style stat. There are a few stats that are closely related to coaching style. Stuff like adjusted tempo, average possession length, and 3-point attempt rate are the stats that show the most consistency from season-to-season among coaches, with correlation coefficients ranging from .626 to .635 over the four seasons from 2022 to 2025. But average two-point distance beats them all:
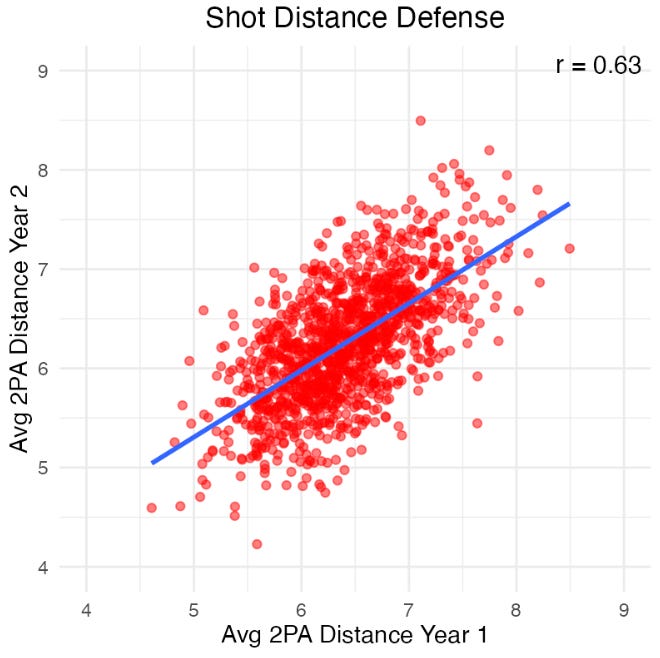
So we could adjust this stat in various ways, but given how well it tracks for the same coach from season to season in its raw form, that seems like overkill for general use. The season-to-season consistency is almost as strong on defense:
Whether this is a style stat or a skill stat is a debate that will surely rage on indefinitely at water coolers across the land, much like the wave-particle duality of light was not settled for decades in the 19th century. In certain experiments, light is seen to behave as a wave, but in other experiments, it behaves as particles. Similarly, 2-point attempt distance may be seen as measuring skill or style depending on the context.
It is not hard to find specific examples of the style aspect. Marquette is perhaps the best example this season. Shaka Smart’s teams are routinely among the best at minimizing 2PA shot distance, ranking second, third, and third in the country in the previous three seasons. This has worked out to having some very nice 2P% offenses, including finishing fourth in the country in 2023.
But this year has been different. Marquette is threatening to have its worst season this century, and their 2-point shooting is a woeful 47.7%, ranking 288th in the country. Through four Big East games, it’s been an even bigger struggle, with the team shooting 42.4% on 2’s.
Yet Marquette is still one of the best at getting shots near the rim, ranking third overall in average 2PA distance. If Marquette’s season could be summarized in one play, it’s this Chase Ross miscalculation on a fast break:
The Golden Eagles have a lack of perimeter shooting threats so it figures that their shots at the rim are quite a bit more difficult that they have been in the past. But they’ll keep trying.
The flip side would be Purdue, who ranks 344th in 2PA distance, yet ranks 37th in 2P%. They ranked 314th in 2PA distance last season, although they were closer to the middle of the pack in the Edey era. But now they rely on mid-range merchant Trey Kaufman-Renn and it’s hard to be critical of the approach given the Boilermakers currently have the top-ranked offense in the country.
But more often than not, long-distance 2’s are a bad thing. Tom Izzo’s teams have been woeful in this 2PA distance over the past five seasons, and while the offense has been acceptable (though lagging behind a great defense over the past three years), it’s in spite of the Spartans’ mediocre 2-point shooting.
Kelvin Sampson takes Izzo a step further. Incredibly, Houston ranked second-to-last in 2PA distance last season, contributing to a 2P% that ranked 289th in the country. Nevertheless, the Cougars were a shot away from the national title, thanks to elite offensive rebounding, turnover avoidance, and three-point shooting to go with the nation’s best defense.
This season, Houston ranks fifth-worst in 2PA defense and while the 2P% is better than last season (151st), it figures to take a hit against Big 12 competition. And considering that the team lacks the 3-point shooting it had last year and that the defense is no longer the best in the country, it’s going to be difficult for Houston to play itself back into national contender with an offense dependent on making so many tough 2’s.
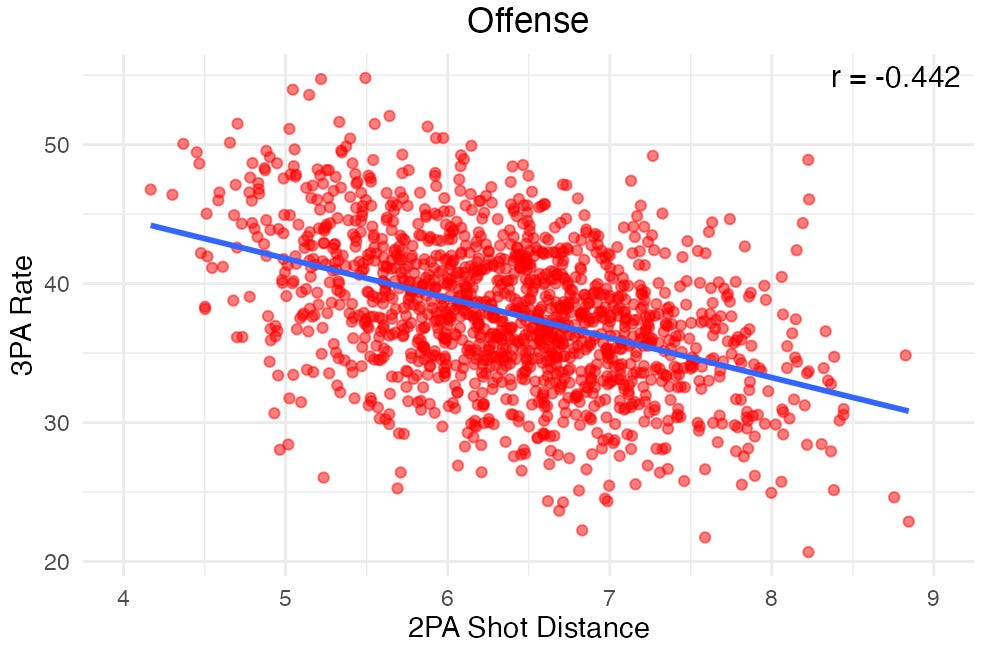
Finally, given that teams that take more 3’s tend to have a higher 2P%, it shouldn’t be surprising that teams that take more 3’s also tend to take shorter 2’s.
Which is why we should admire Arizona, who takes few 3’s and somehow still has a low 2PA distance. But they are the exception. The Wildcats are one of just two teams in the bottom 50 of 3PA rate that is in the top 100 of 2PA distance (Cal Baptist is the other).
That’s enough on 2PA distance for now, but I’m sure I’ll talk about it more. Eventually, I’ll get game values in the box scores. We only have complete data for the past 5 seasons, but that’s enough to history to see which coaches excel in this measure.
Or at least mostly the raw average. There is some light editing in specific cases to reduce scorekeeper bias.
I've been looking all over the site for this explanation since a couple days ago when Seth Fisher at Mgoblog.com referred to it without any explanation of his own. In the process, I signed up for the newsletter, thank-you. I'm really surprised to read that the stat is a measure of ALL 2P shots, not just MADE ones. Hard for me to get my head around the fact that the mean 2P shot distance is only about 6 feet. A six foot circle measured from the center of the hoop is 100% in the paint, and covers less than half of the paint area overall. That said, I'd be curious to also know what the median is and what is the average MADE 2P shot and average MISSED 2P shot.
Enjoyable article! Reminded me that I met a guy at Syd’s Fine Foods and Spirits last night who is a Coach Mike Woodson fan.
Sadly, we did not discuss average two point distance.